Logging with Chalice
A friend in need is a friend indeed
Logging is your friend. Without proper logging (and tracing) it can be very difficult to understand why the application broke down at 3:15 in the morning and PagerDuty is screaming at you.
From Logging best practices in Software Development
From an application point of view, logs are designed to enhance communication between users and the application software. Having appropriate logs with exceptional search capabilities is similar to having an artificial lighting appliance in a dark room.
Most software developers neglect the significance of logs in resolving software issues. However, the fact is, logs are indispensable when it comes to addressing software issues and helping the developers to know the health status of the application. Also, logs are pivotal to the performance of an application. If you’re a developer and have no insight into logs as a programming tool, you’re missing an invaluable tool to better your development career.
Logging with Chalice can be easy or very easy.
Very easy logging
AWS Lambda will log anything
that is written to stdout, meaning you can simply print() your log messages and be done with it.
from os import getenv
from chalice import Chalice

try:
    from dotenv import load_dotenv

    load_dotenv()
except ImportError:
    pass

first_name = getenv("WORKSHOP_NAME", "ivica")  # replace with your own name of course

app = Chalice(app_name=f"{first_name}-savealife")

@app.route("/donor/signup", methods=["POST"])
def donor_signup():
    body = app.current_request.json_body

    print(f"Received JSON payload: {body}")

    return body
Run the local server if it is not already running with chalice local --autoreload and invoke your function:
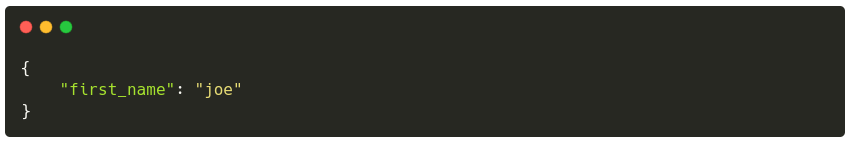
http :8000/donor/signup first_name=joe
Output should be similar to:
and in another terminal window/tab
chalice local --autoreload
will output
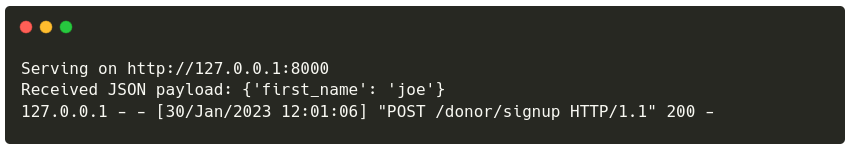
It is not the prettiest or the most informative log line but

Easy logging
As we saw earlier, Chalice supports print()-style logging which is not the most informative but it gets the job done.
If you would like more information from your logs and you are used to the Python logging from stdlib you’ll be pleased to
know that Chalice comes with a preconfigured logger that can be accessed via the app.log attribute. You may use it like
so:
import logging
from os import getenv
from chalice import Chalice
try:
from dotenv import load_dotenv
load_dotenv()
except ImportError:
pass
first_name = getenv("WORKSHOP_NAME", "ivica") # replace with your own name of course
app = Chalice(app_name=f"{first_name}-savealife")
app.log.setLevel(logging.DEBUG)
@app.route("/donor/signup", methods=["POST"])
def donor_signup():
body = app.current_request.json_body
app.log.debug(f"Received JSON payload: {body}")
app.log.info("This is a INFO level message")
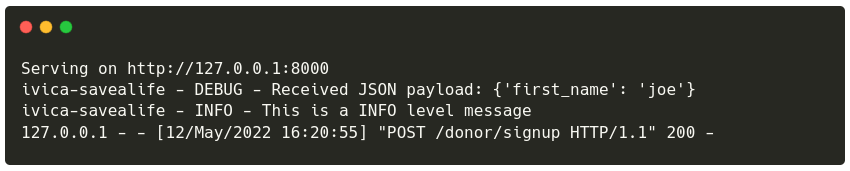
return bodyWhich produces log messages that feel like messages produced by the logging module from the standard library.
http :8000/donor/signup first_name=joe
will output:
Deploy these changes with chalice deploy and invoke the function:
http -b POST $(chalice url)/donor/signup first_name=joe
Output should be the same as when we invoked the function locally::
But how can we view these logs? And where are they?
chalice logs
will output something similar to:
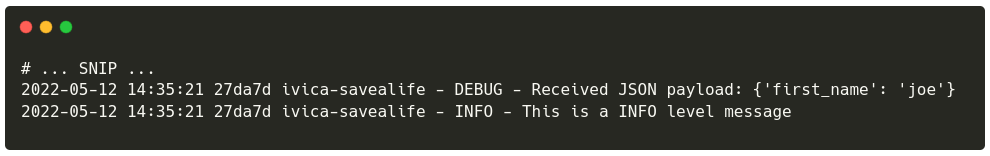
These logs are stored remotely in a service called AWS CloudWatch. Apart from log storage it provides metrics, dashboards and alarms for resources in your account (Lambda functions, DynamoDB tables etc.)
Dates and times in CloudWatch are in UTC timezone (two hours behind current time)
Log lines are delivered to CloudWatch in an eventually-consistent manner. This is a fancy way of saying “it may take a few seconds for them to appear in CloudWatch after you invoked your function”